3 minutes
Wordclouds
An easy and effective way to visualize text data is to use wordclouds. Wordclouds allow you to see all the words from your corpus in one image where the size of the word is proportional to its word count in the data.
Wordclouds are a powerful tool and can convey a lot of information as well as make a presentation look nice and professional. Here we use the Python library WordCloud and go a bit beyond the default parameters to get some interesting visualizations.
The data used to make the illustrations are tweets from the disaster dataset available on Kaggle.
Download and clean the data
import pandas as pd
# load the data
train = pd.read_csv("data/train.csv")
# text pre-processing for tweet data
import re
import string
import emoji
from nltk.corpus import stopwords
import html
stopwords = set(stopwords.words('english'))
def process_text(text):
# remove special characters
text = ''.join([c for c in text if c in string.printable])
# remove twitter specifics
text = re.sub(r'@[A-Za-z0-9_]+','',text)
text = re.sub(r'#','',text)
text = re.sub(r'RT : ','',text)
text = re.sub(r'\n','',text)
# to remove emojis
text = re.sub(emoji.get_emoji_regexp(),'', text)
# remove numbers
text = re.sub(r'[-+]?[.\d]*[\d]+[:,.\d]*','', text)
# URLs
text = re.sub(r'https?:\/\/[A-Za-z0-9\.\/]+','', text)
text = re.sub(r'https?://\S+|www\.\S+','', text)
# HTML beacon
text = re.sub(r'<.*?>','',text)
# punctuation
text = re.sub(r'[!"#$%&\'()*+,-./:;<=>?@[\\]^_`{|}~]',' ', text)
# stop words
# text = ' '.join([word.lower() for word in text.split() if word.lower() not in stopwords])
# &
text = html.unescape(html.unescape(text))
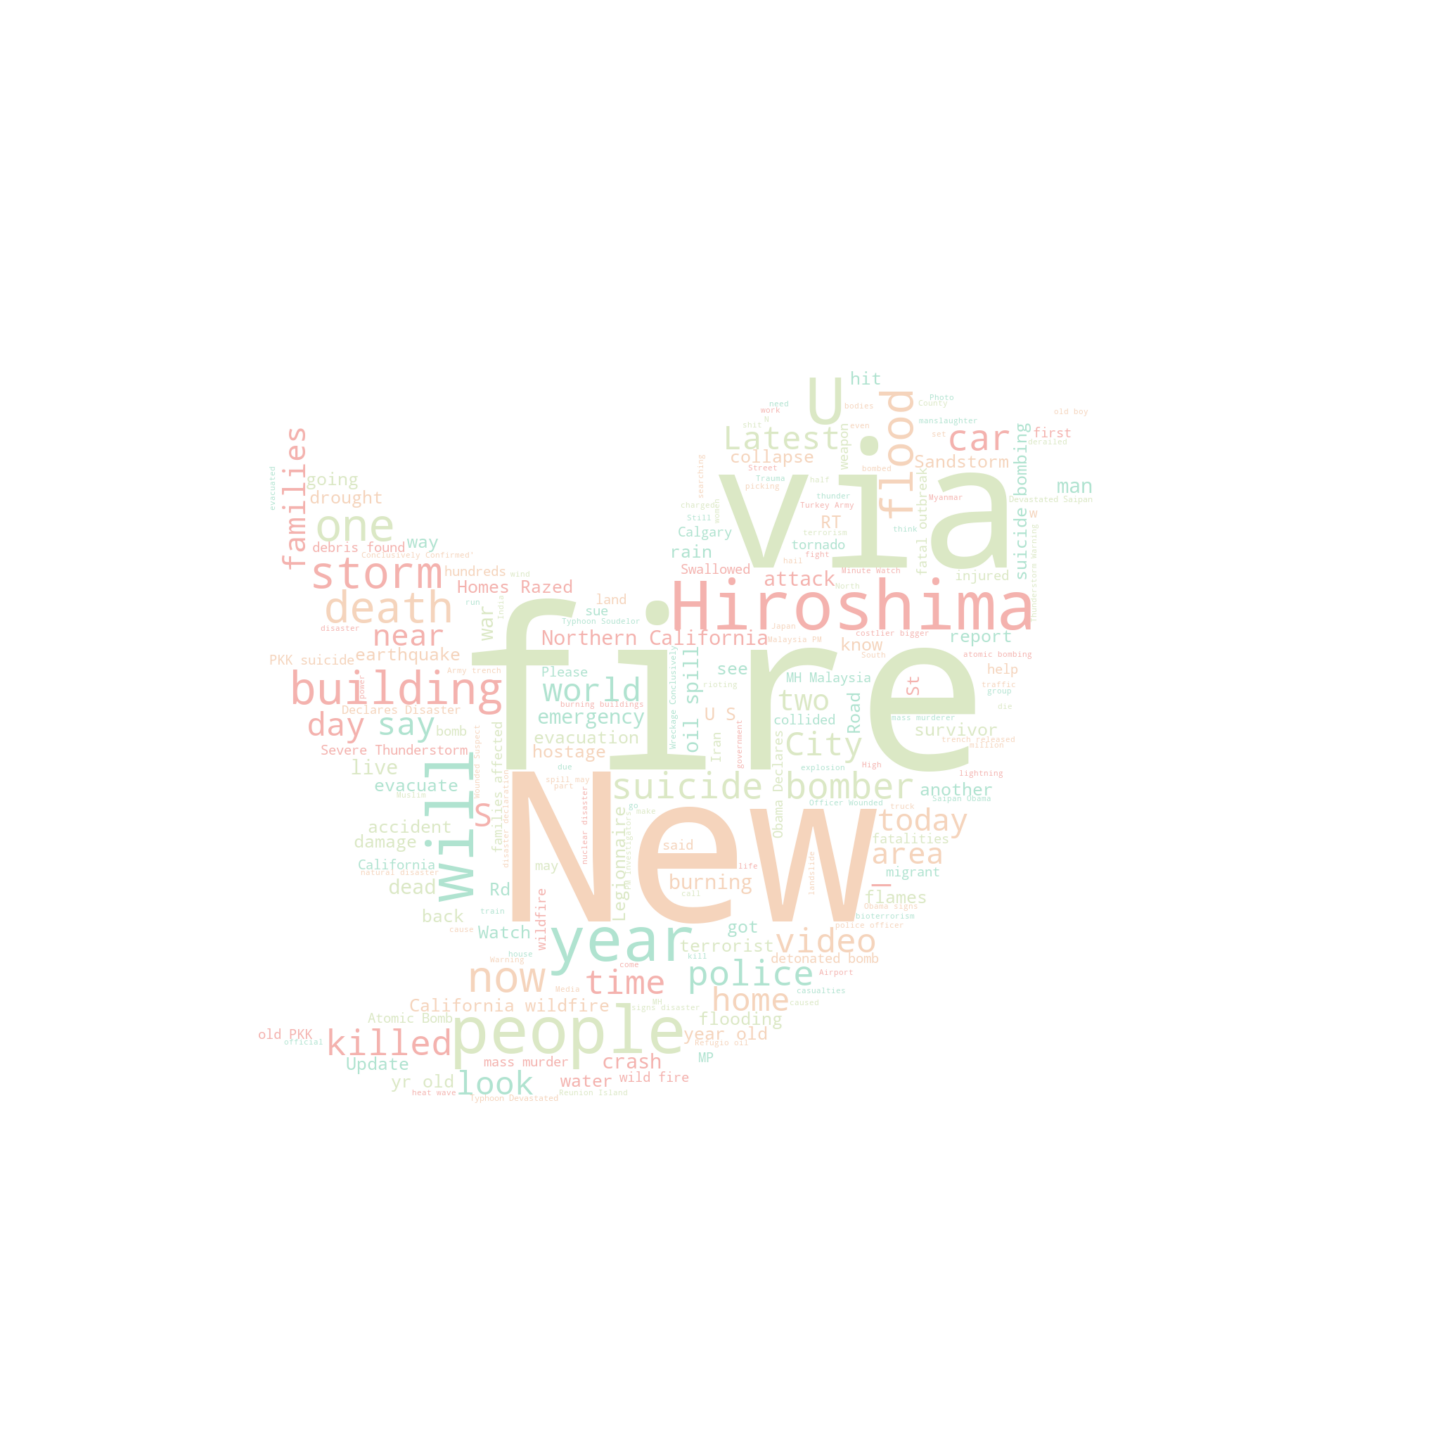
return textOnce the data has been cleaned, we can make a wordcloud. The code below uses a mask so that the wordcloud is shaped like the Twitter logo. The mask is a jpeg image of 1488x2048 pixels (try to find a large image for your mask as well). The wordcloud also uses the characteristic Twitter blue color by simply taking it from the logo in mask_colors.
from wordcloud import WordCloud, STOPWORDS, ImageColorGenerator
from PIL import Image
import random

# Inputs
tokens = ' '.join(train['text_processed'][train['target'] == 1])
path_mask = "img/twitter_logo.jpeg"
IMAGE_SIZE = 1000
MAX_WORDS = 2000

# Mask
mask = np.array(Image.open(path_mask).convert('RGB'))
mask_colors = ImageColorGenerator(mask)
# rescale mask
scale_factor = IMAGE_SIZE/min(mask.shape[1], mask.shape[0])
new_width = int(mask.shape[1]*scale_factor)
new_height = int(mask.shape[0]*scale_factor)

wordcloud = WordCloud(width=new_width, height=new_height,
                      background_color='white',
                      mask=mask,
                      color_func=mask_colors,
                      random_state=seed,
                      max_words=MAX_WORDS,
                      stopwords=set(STOPWORDS),
                      min_font_size=10).generate(tokens)

plt.figure(figsize=(20,20), facecolor=None)
plt.imshow(wordcloud, interpolation="bilinear")
plt.axis("off")
plt.tight_layout(pad=0)
plt.savefig("img/tweets_wordcloud.png")
plt.show()
The script above re-uses the color from the twitter logo from the image twitter_logo.jpeg. But you can manually change the palette of colors by setting the color_func parameter in WordCloud with a custom function like the one defined below.
# Color function
def multi_color_func(word=None, font_size=None, position=None, orientation=None, font_path=None, random_state=None):
    colors = [[4, 77, 82],
              [25, 74, 85],
              [82, 43, 84],
              [158, 48, 79]]
    rand = random.randint(0, len(colors) - 1)
    return "hsl({}, {}%, {}%)".format(colors[rand][0], colors[rand][1], colors[rand][2])